
Felcorp Support

Monitoring, Detection & Incident Response Security
How Felcorp monitors endpoint activity, identity access and operational processes to detect and respond to security issues.
Last updated
March 9, 2026
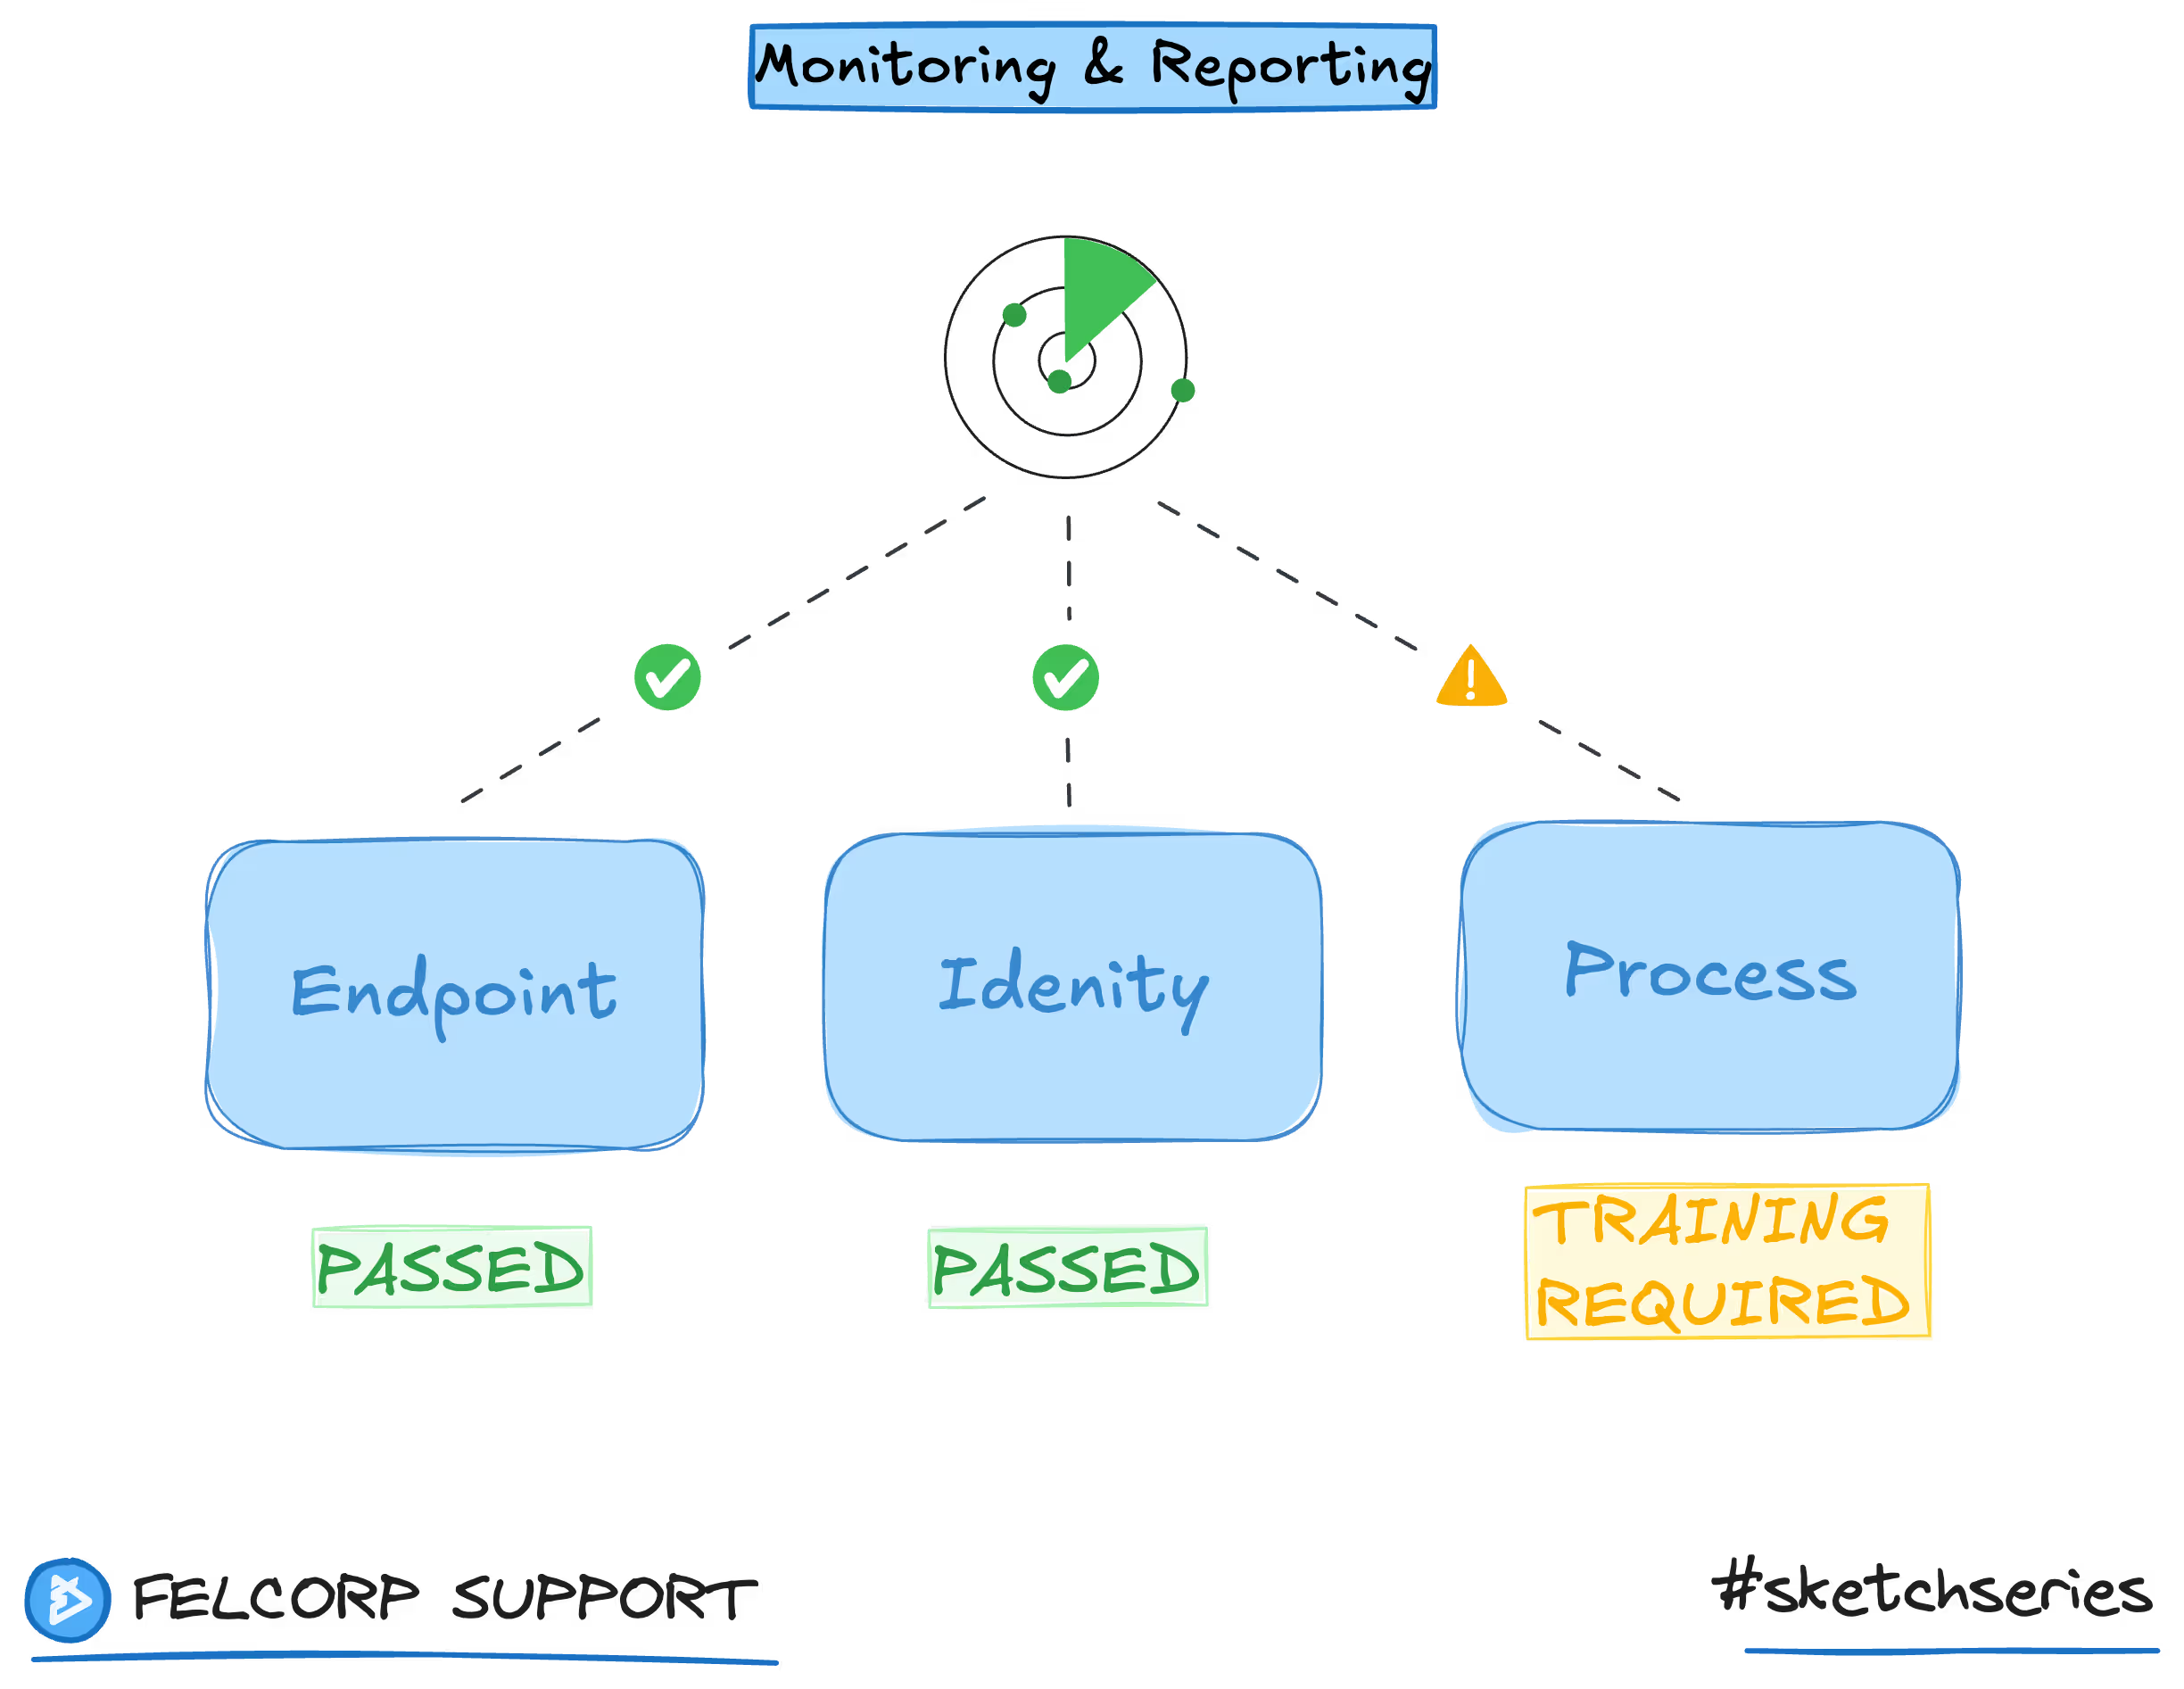
Monitoring and reporting give you visibility into what your outsourcing partner is doing. Without monitoring, you're operating blind. Without reporting, you can't spot problems until they're serious.
Incident response and data protections are built into the monitoring framework to detect and respond to issues quickly.
Here's what good monitoring and reporting looks like in a BPO operation.
Operational metrics
You should have visibility into basic operational metrics:
Volume. How much work is being completed? Day over day, week over week, and month over month, is volume trending up or down?
Turnaround time. How long does it take to process a work item? Is turnaround time consistent or variable?
Capacity utilization. Is your team working at full capacity? Is there excess capacity? Are they overloaded?
Staffing. How many people are on your team? Is staffing stable or changing? How does staffing compare to plan?
Cost per unit. What does each unit of work cost? Is cost trending up or down?
These operational metrics tell you if your operation is running efficiently.
Quality metrics
You should also have visibility into quality:
Error rate. What percentage of work has errors? Is error rate trending up or down?
Rework rate. How much work needs to be reworked? Is rework decreasing over time?
Customer complaints. How many customers complain about quality or speed? Are complaints increasing or decreasing?
Quality scores. If work is being quality checked, what percentage passes quality review?
Quality trending. Over time, is quality improving or declining?
Good quality metrics give you early warning of quality issues before they become serious.
SLA compliance
Your Service Level Agreement should specify performance metrics. You should have visibility into whether you're meeting your SLAs:
Response time SLA. Are responses happening within the agreed timeframe?
Availability SLA. Is the service available when you need it?
Accuracy SLA. Are results meeting accuracy targets?
Completeness SLA. Is work being delivered complete?
You should have a dashboard showing current and historical SLA compliance. Trending is important. Is SLA compliance improving or declining?
Staffing and security metrics
You should have visibility into staffing and security:
Staff turnover. How many staff left this month? What was the turnover rate?
New staff onboarding. How many new staff were trained? Are they ramping up to full productivity?
Security incidents. Were there any security incidents? How were they handled?
Access violations. Were there any attempts to access unauthorized systems? How were they handled?
Training completion. Is all staff trained on security and compliance? Is training current?
These metrics give you visibility into staffing stability and security.
Frequency of reporting
Reporting should be frequent enough that you can spot problems quickly:
Daily reporting. For critical operations, daily dashboards let you see if something is wrong the next day.
Weekly reporting. Most operations should have weekly reviews of key metrics.
Monthly reporting. Monthly reports should cover SLA compliance, quality trends, costs, and staffing.
Quarterly business reviews. Meet with your provider quarterly to discuss performance, trends, and plans.
Dashboards and visualization
Reports should be visualized in dashboards, not spreadsheets. Dashboards let you see trends at a glance. They let you drill down into details when you see something wrong.
A good dashboard shows:
Current performance against target
Trend over time (are things improving or getting worse?)
Drill-down capability (why is X metric off target?)
Alerts for metrics out of range (notify me if error rate exceeds 5%)
The best dashboards are interactive. You can drill down, slice by different dimensions, and explore the data.
Comparing performance to targets
Reports should compare actual performance to targets. If your target is 1% error rate and actual is 3%, you should see that visually. Red for miss, green for hit.
This makes it obvious when something is off. You don't have to calculate whether you're on track. The report tells you.
This visual comparison makes it easy to spot problems in real time and take corrective action.
Trend analysis
Reports should show trends over time. Are you getting better or worse? This is more important than the current metric.
If error rate is 3% and was 5% last month, you're trending positive. If error rate is 3% and was 2% last month, you're trending negative.
Trends let you predict where you're headed and take action early if trends are negative.
Root cause analysis
When something is off target, your provider should investigate why. Reports should include root cause analysis:
If error rate is high, why? Are there specific types of errors? Are there specific staff members with quality issues?
If turnaround time is slow, why? Is volume unusually high? Is staffing low? Are there system issues?
If cost per unit is high, why? Is utilization low? Are efficiency issues?
Root cause analysis tells you what to fix, not just what's broken.
Customer feedback
Your provider should collect and report customer feedback:
Customer satisfaction scores. How satisfied are your customers with the service?
Customer complaints. What are customers complaining about?
Customer sentiment. Is sentiment trending positive or negative?
This feedback is incredibly valuable. It catches issues that operational metrics might miss.
Incident tracking
Your provider should track and report incidents:
Security incidents. Unauthorized access attempts, data leaks, system breaches.
Operational incidents. System downtime, quality failures, missed deadlines.
Customer incidents. Customer complaints, escalations.
Each incident should have:
What happened (incident description)
When it happened
Root cause (why it happened)
Remediation (how it was fixed)
Prevention (how to prevent recurrence)
Proactive monitoring
The best providers don't just report metrics. They monitor proactively and alert you to issues before they become serious:
Error rate trending up? Alert issued at 2% error rate (before 5% threshold)
Turnaround time slowing? Alert issued when trending negative
Staff absences unusual? Alert issued for staffing drops
Proactive monitoring lets you fix issues early, before they impact customers.
The bottom line
Monitoring and reporting give you visibility into your outsourcing operation. You should have dashboards showing operational metrics, quality metrics, SLA compliance, and staffing. Reports should be frequent (at least weekly), visual, trend-oriented, and include root cause analysis. This visibility lets you spot problems early and work with your provider to fix them.
On this page